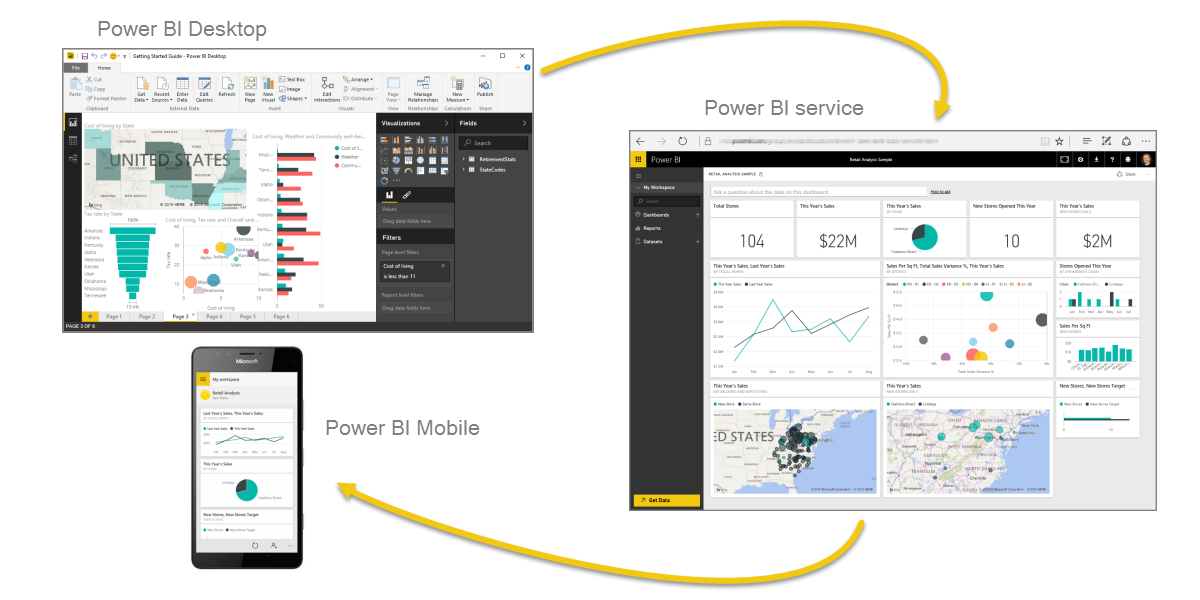
Custom Dashboards for Data Analysis
Microsoft Power BI has evolved into a leading Business Intelligence and Analytics tool, providing innovative organizations with a robust solution for reporting and analysis. With Power BI, companies can easily extract and convert data from various distinct sources to gain valuable insights.
Its capabilities for analysis and interactive visualization offer an unparalleled user experience on any type of device.

By using Power BI, organizations can analyze data from various perspectives without relying on IT support to create and manage reports for end-users. This means that everyone in the business area can leverage Power BI's capabilities to extract meaningful insights and make informed decisions based on data.
I offer specialized services in Power BI and Business Intelligence to allow data-driven decision-making in businesses of various sizes.
Centralize your information and ensure quick and accurate insights for more assertive decision-making. I develop Power BI dashboard models for any need. Turn your BI project into reality! Services for human resources, project management, marketing, production, sales, or finance.
Solutions are developed and customized to the unique needs of each client, providing valuable insights to drive business growth.
Maximize the potential of Power BI by seamlessly integrating it with other platforms and tools, creating a complete solution for your analytical needs.
Support in all phases, from implementation to training, ensuring maximum utilization of the platform:
Planning
Definition, together with the client, of business areas (Finance, Marketing, Sales, Logistics, Operations, among others) and the subjects that will be covered in the BI (Business Intelligence) project.
Understanding the Business and Data Sources
Mapping of business areas, information flow, analysis of the current process, survey of transactional systems (ERP, CRM, and other systems used by the client), definition of key performance indicators (KPIs), metrics, user access hierarchy, and technological structure.
In this same step, types of structured and unstructured data sources (SQL Server, Oracle, MySQL, PostgreSQL, NoSQL, Excel Spreadsheets, among others) are mapped, along with the content and structure of these databases (types of variables), and understanding the storage location of data sources.
Data Architecture
The architecture of the data project will be defined based on the characteristics of the application (data volume, quantity of accesses, data type). The environment of Data Mart, Data Warehouse (DW), Data Lake, or simply the replication of the original database will be defined, in addition to data integration technologies and data storage location.
Data Preparation
This is the stage we call data extraction, transformation, and loading (ETL) or, depending on the tool, we can call it data extraction, loading, and transformation (ELT).
This phase of the project is the data modeling stage, that is, it is the stage where data structures that will support business processes will be built, in addition to organizing the data and its relationships.
Data Visualization
Once the data is modeled, dashboards are created for presenting key performance indicators (KPIs) and metrics.
At this stage, the standard layout of colors, types of charts, arrangement of information, and analyses according to the profile of the business area will be created. Centralize your information and ensure quick and accurate insights for more assertive decision-making.
Please get in contact for a personalized consultation and discover how Power BI can drive your company's success.
The functionalities and capabilities of BI are improving rapidly, which can be challenging for users to keep up with all new visualizations, create meaningful dashboards, and truly have control over their data.
I also offer private Power BI lessons for those who want to learn how to use the tool.
